When you are looking at a stock profile on StockUp, one of the most heavily utilized widgets is our proprietary End-of-Year (EOY) Price Target. It gives you a clear, directional projection of where we see the asset closing out the calendar year.
But a price target without a thesis is just a number. Serious traders don't just want the destination; they need to understand the roadmap. You need to know the assumptions, the risks, and the specific catalysts driving that valuation.
Today, we are thrilled to announce a major upgrade to this feature: The StockUp EOY Explanation Panel. We are opening the black box, giving you transparent, institutional-grade rationale for our EOY targets with a single click.
Unlocking the "Why"
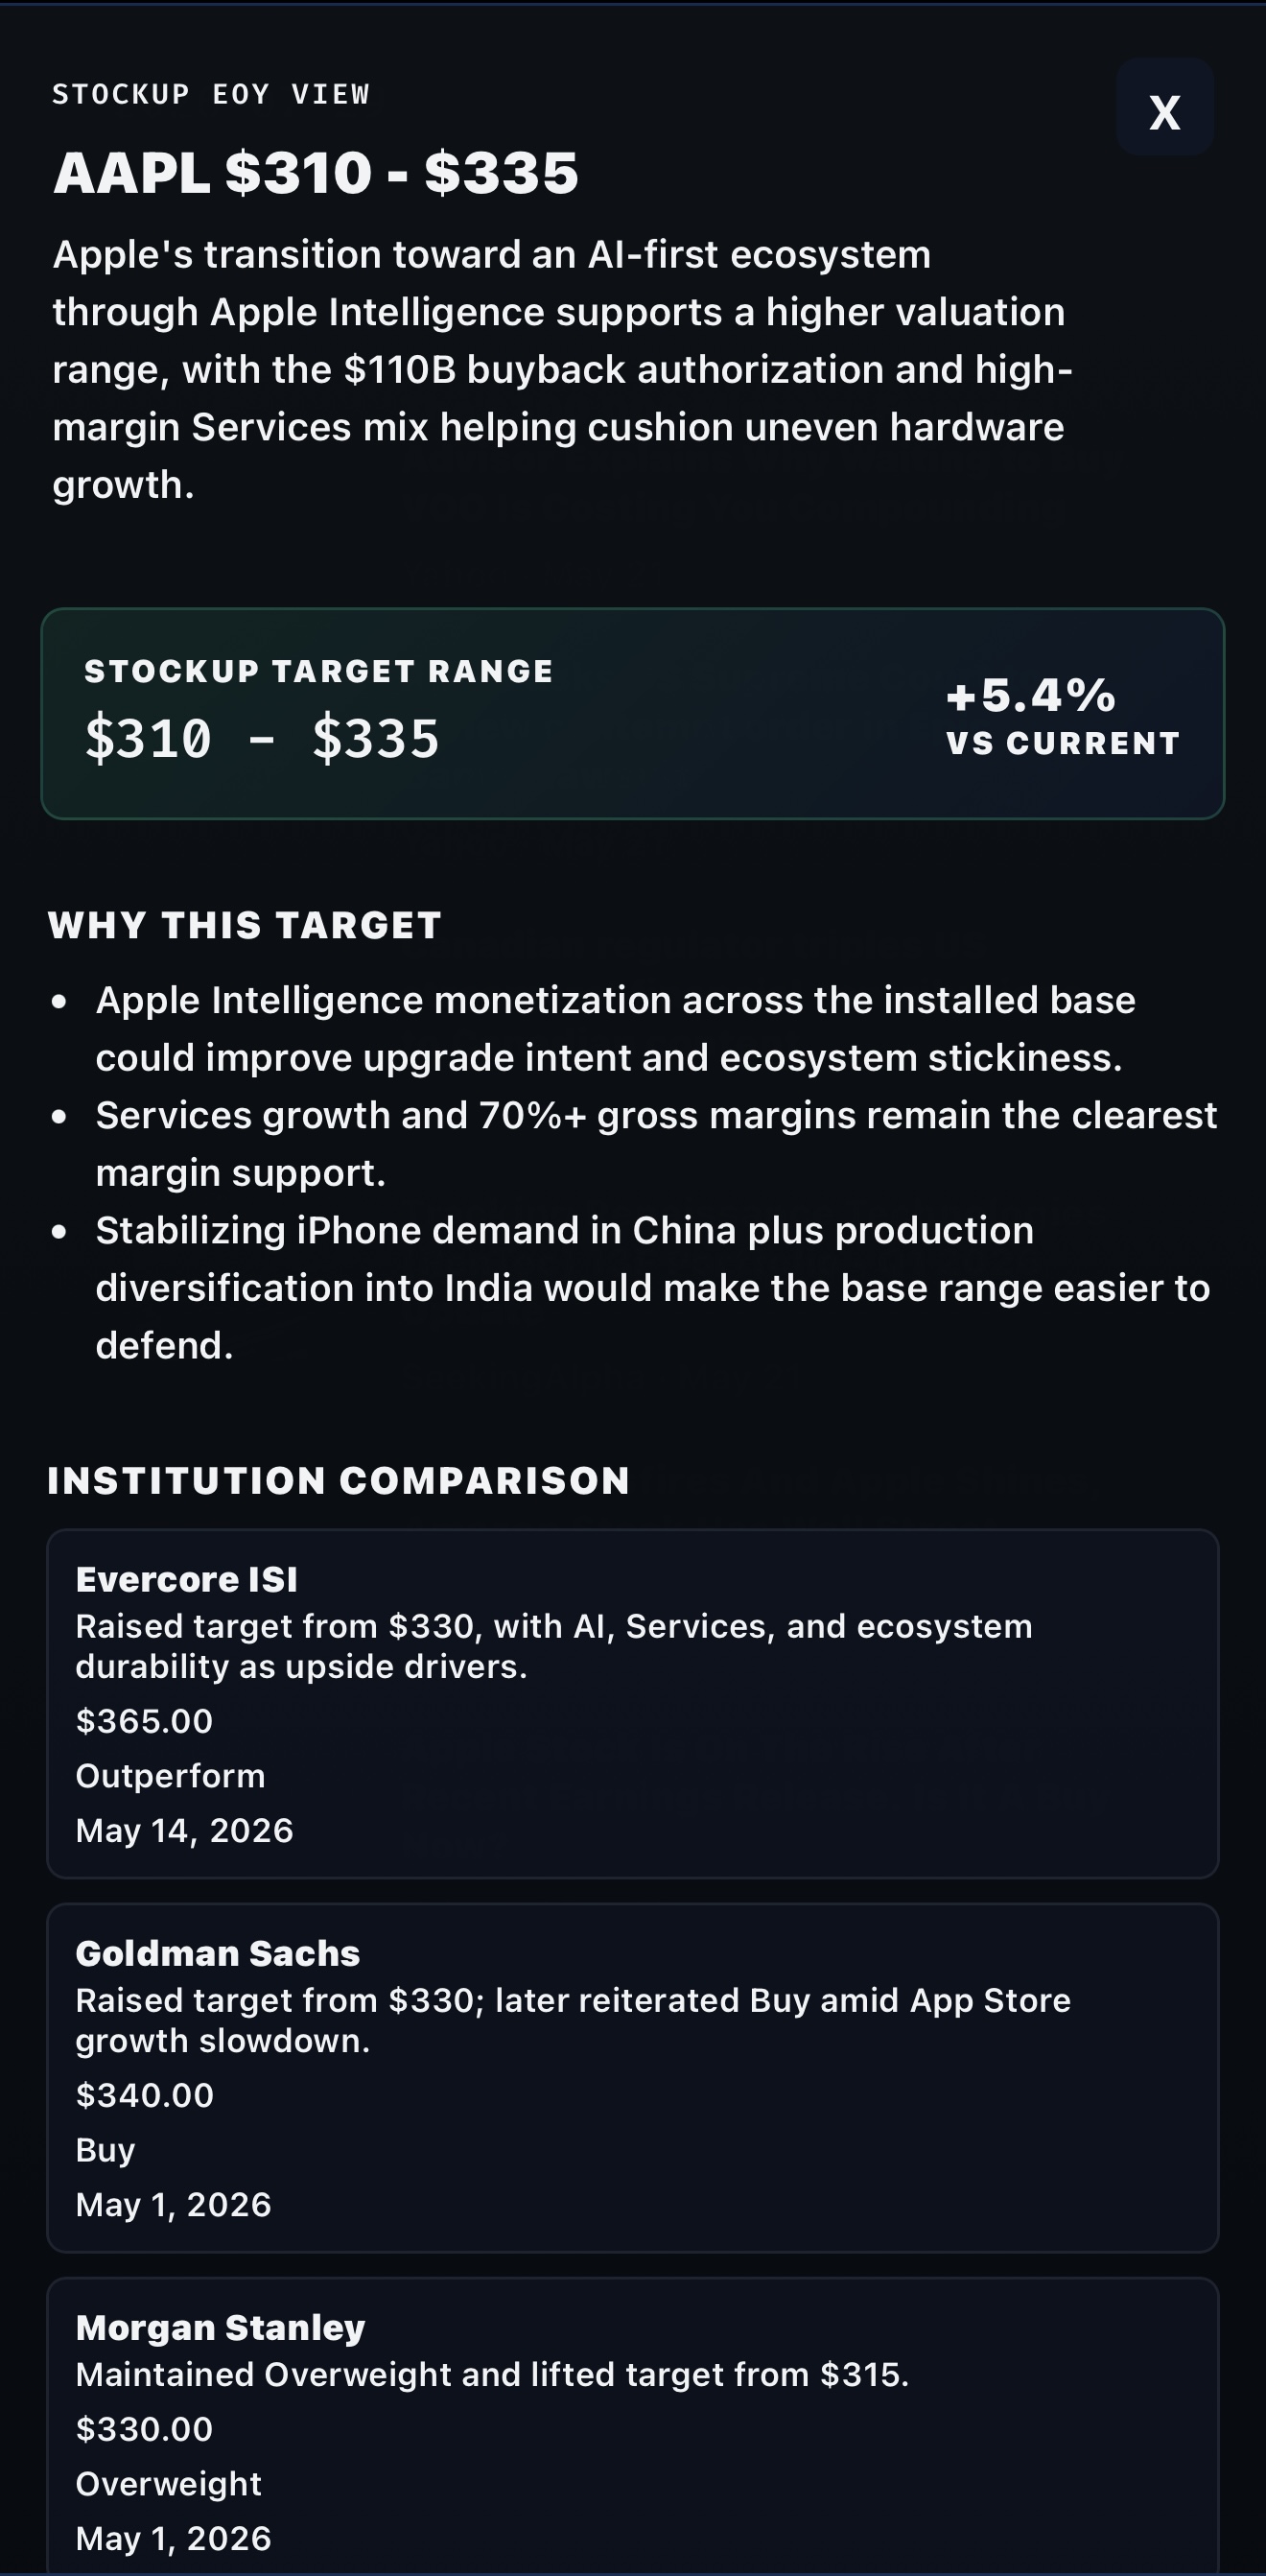
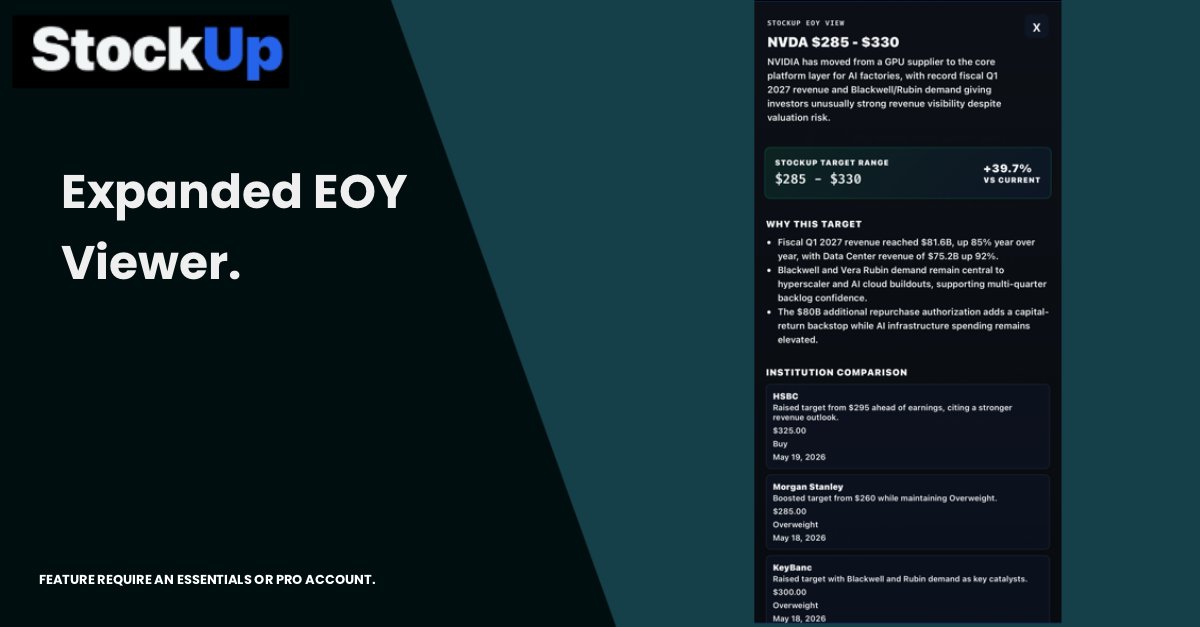
Starting this week, the StockUp EOY widget is fully interactive. Clicking on a supported EOY target will slide open a polished, deep-dive explanation panel right over your sidebar (or as a clean, full-screen sheet on mobile).
Instead of just giving you a price, this new panel reads like a compact, high-impact research report dedicated entirely to that specific stock. Inside the panel, you will find:
- The Thesis Headline: A one-sentence summary of the core driving force behind the valuation.
- Dynamic Upside/Downside Chips: A live visual indicator showing exactly how much runway exists between the real-time trading price and our EOY target.
- Bull, Base, and Bear Scenarios: We break down the exact conditions required for the stock to overperform, meet our baseline expectations, or succumb to downside pressure.
- Key Drivers & Risks: A no-nonsense bulleted list of the specific catalysts pushing the stock forward, and the hidden headwinds that could prove our target wrong.
StockUp vs. Wall Street
We know you don't look at our targets in a vacuum. You want to know how our projections stack up against the broader market.
To provide that context, the new explanation panel includes a built-in Institution Comparison Table. If you have your Finnhub API key connected, the panel will seamlessly pull in the live Wall Street consensus, letting you compare the StockUp target directly against the Street's High, Low, and Average targets in real time. Even if you don't have a key connected, the panel will fall back on hard-coded institutional benchmarks from top-tier firms so you never lose perspective.
Zero Token Cost, Maximum Speed
Because these rationales are meticulously researched and hard-coded by our team—rather than generated on the fly by our AI—accessing the EOY Explanation Panel costs you zero AI tokens. It is instant, expertly curated, and features a "Last Reviewed" timestamp so you always know exactly how fresh the thesis is.
Initial Rollout
To ensure the highest quality of analysis, we are launching the EOY Explanation Panel with a highly curated list of megacaps and high-volume tech stocks, including Apple ($AAPL), Microsoft ($MSFT), Nvidia ($NVDA), Alphabet ($GOOGL), and Lockheed Martin ($LMT).
If you click on a ticker that hasn't received a full StockUp rationale yet, the panel will gracefully let you know, keeping the interface clean and predictable. We will be continually expanding our covered assets over the coming months.
We built StockUp to give retail investors the same forensic tracking and analytical depth as billion-dollar trading desks. The EOY Explanation Panel is the next major step in that mission. Log into your terminal, pull up one of our supported tickers, and click the EOY widget to explore the thesis behind the numbers.