AI 10-Q analysis means using an AI model to pull the figures, management's explanations and risk disclosures out of a company's quarterly SEC filing and explain them in plain language. Done well, it ties every number to the filing it came from, compares like periods, and tells you what the filing doesn't say.
The same method works for a 10-K. This guide explains what each filing contains, gives a step-by-step way to analyze one with AI, and shows how Quan 3.5 handles filing data.
10-Q vs. 10-K vs. 8-K
U.S. public companies report through a handful of SEC forms. Three matter most for following results.
| Form | What it is | When it's due | Audited? |
|---|---|---|---|
| 10-Q | Quarterly report for the first three fiscal quarters | 40 days after quarter end for large accelerated and accelerated filers, 45 days for others | No. Statements are reviewed by the auditor, not audited |
| 10-K | Annual report, with the full business description and risk factors | 60, 75 or 90 days after fiscal year end, depending on filer size | Yes, the financial statements are audited |
| 8-K | Current report on material events | Generally within four business days of the event | No. Earnings releases are usually furnished under Item 2.02, with the release as Exhibit 99.1 |
There is no 10-Q for the fourth quarter. Fourth-quarter numbers sit inside the 10-K's annual figures, so a fourth-quarter result is often worked out as the full year minus the first nine months. That works for revenue and income. It doesn't work for earnings per share, because the share count changes during the year. Quan's reports follow the same rule: their methods note says fourth-quarter dollar flows may be calculated that way, and EPS is never calculated by subtraction.
The earnings release usually arrives first, on an 8-K. For reading that release, see our guide to AI earnings report summaries.
What's inside a 10-Q
- Part I, Item 1: Financial statements. Income statement, balance sheet, cash flow statement and the notes. The notes hold segment data, debt terms and commitments.
- Item 2: MD&A. Management explains the results in its own words. This is usually where the "why" is.
- Item 3: Market risk. Exposure to interest rates, currencies and commodities.
- Item 4: Controls and procedures.
- Part II. Legal proceedings, changes to risk factors, share repurchases and exhibits.
The financial data is also tagged in XBRL, a structured format the SEC publishes through EDGAR. That is what lets software pull "revenue for the quarter" without reading a PDF. Segment figures carry extra tags, called dimensions, that link each value to its segment.
How to analyze a 10-Q with AI, step by step
- Confirm you have the right filing. Check the company, the form type, the period end date and the filing date. An amended filing (10-Q/A) replaces parts of the original, so make sure you know which one you're reading.
- Compare the income statement with the same quarter last year. Ask for revenue, gross profit, operating income, net income and diluted EPS, with the change in each. Ask for year-to-date figures too, because some businesses are seasonal.
- Ask what MD&A says caused the changes, quoted. A direct quote is easier to check than a summary, and it keeps management's explanation separate from the AI's interpretation.
- Move to the balance sheet and cash flow. Look at cash, debt, inventory and receivables against the last fiscal year end, and compare operating cash flow with net income. A large gap between the two is worth a follow-up question.
- Look for changes in risk factors and legal proceedings. A 10-Q usually lists only material changes to the risk factors in the last 10-K, so anything that appears there is new and worth reading.
- Read the segment note. Segment revenue and profit often explain a consolidated result that looks odd on its own.
- Verify before you rely on it. Open the filing and check every figure you plan to use. AI-generated analysis can contain errors.
Reading a 10-K with AI
The method is the same, but the document is much longer. Ask about one section at a time, and ask the tool to tell you when a figure isn't in the filing instead of estimating it. Questions worth asking any AI tool:
- "Summarize the business description in five sentences and list the reportable segments."
- "Compare revenue, operating income and operating cash flow for the last three fiscal years."
- "Which risk factors are new or changed compared with last year's 10-K?"
- "What commitments and contingencies are disclosed in the notes?"
- "Did the auditor's report include any critical audit matters, and what were they?"
We recorded one example of a multi-part 10-K question about purchase obligations and inventory in our SEC filing case study. It is an illustrative run, not a controlled benchmark, but it shows the kind of question that rewards careful reading of the notes.
Ask about a filing you're reading. A free Starter account includes 3 Quan 3.5 answers a month.
Try Quan 3.5 freeHow Quan 3.5 works with SEC filings
For analytical questions about a single company, Quan 3.5 reads the most recently reported period from the company's SEC filings and gives it to the model before it answers. If that lookup fails, the answer goes ahead without it. On the API, the X-Quan-Latest-Earnings: attached response header shows when it happened.
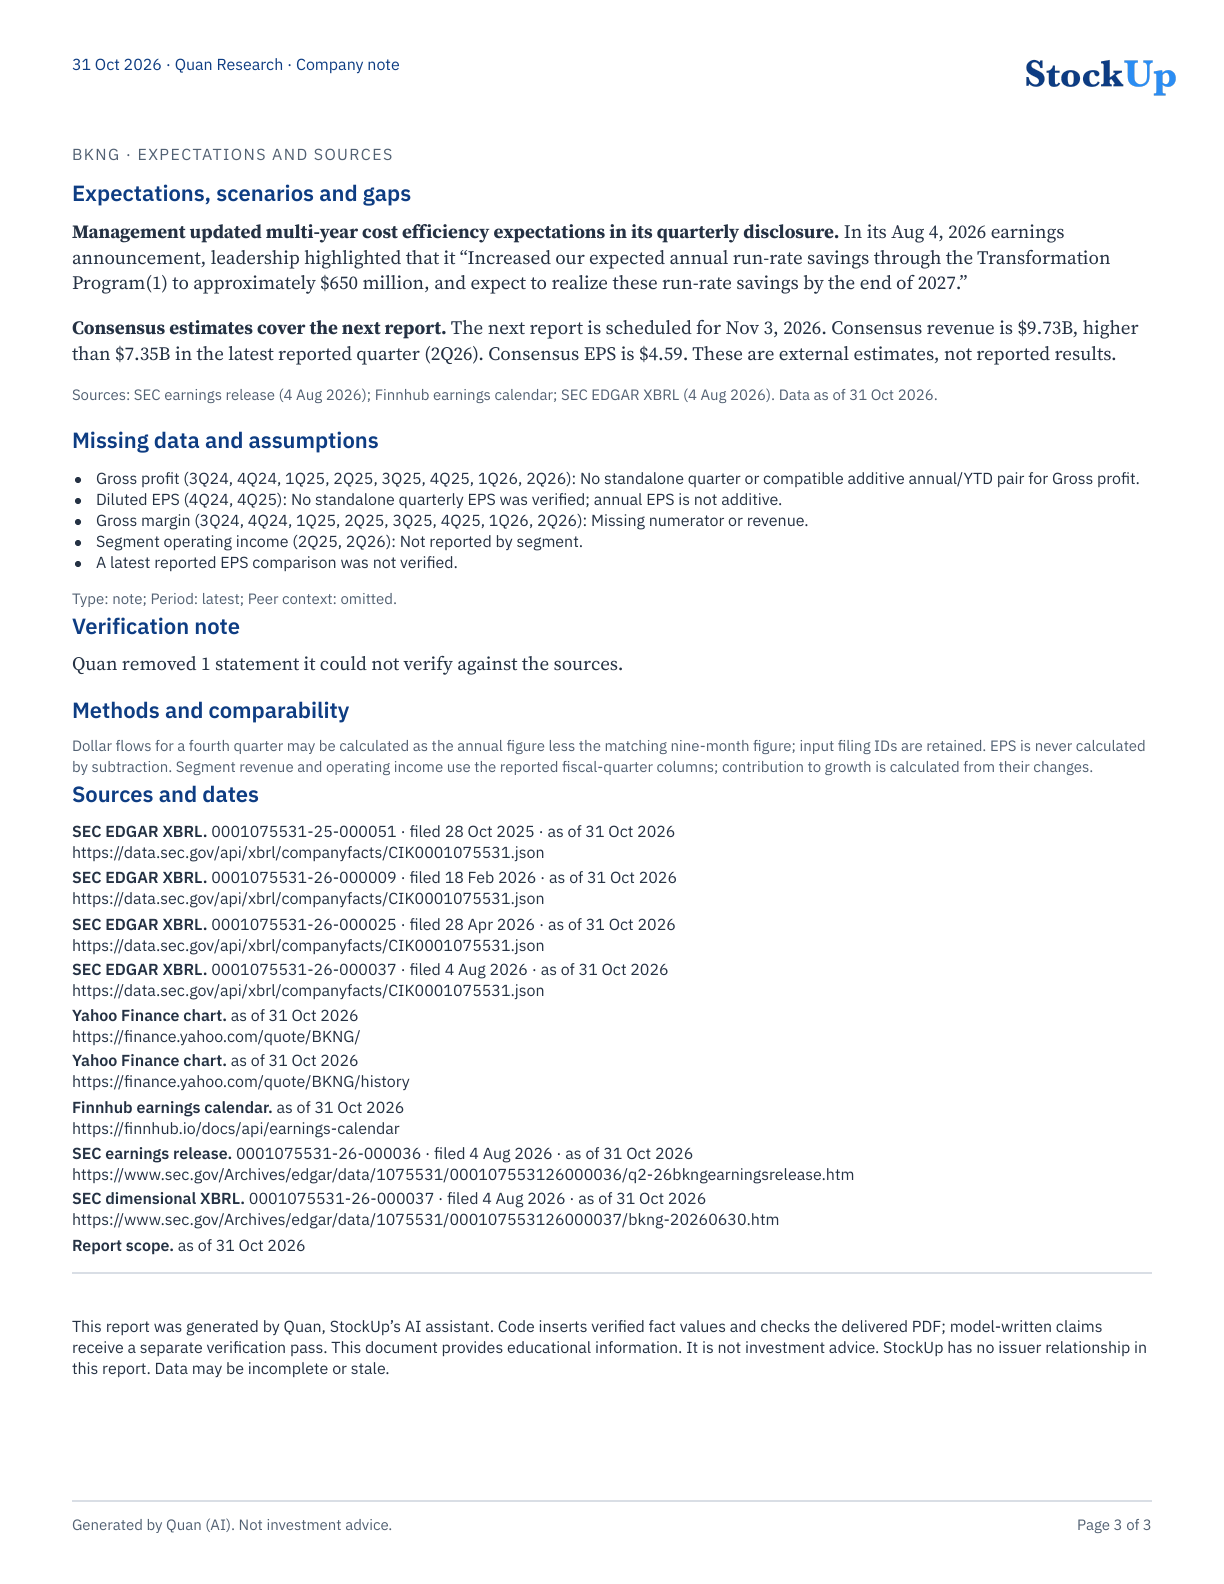
The reports show the sourcing in full. The Booking Holdings company note lists the XBRL data from its 2Q26 filing by accession number (0001075531-26-000037, filed August 4, 2026), next to the earnings release filed the same day. Its missing-data section shows the rules at work:
- Gross profit: not available, because there was no standalone quarterly figure or compatible annual and year-to-date pair.
- Diluted EPS for fourth quarters: not verified, because annual EPS is not additive.
- Segment operating income: not reported by segment.
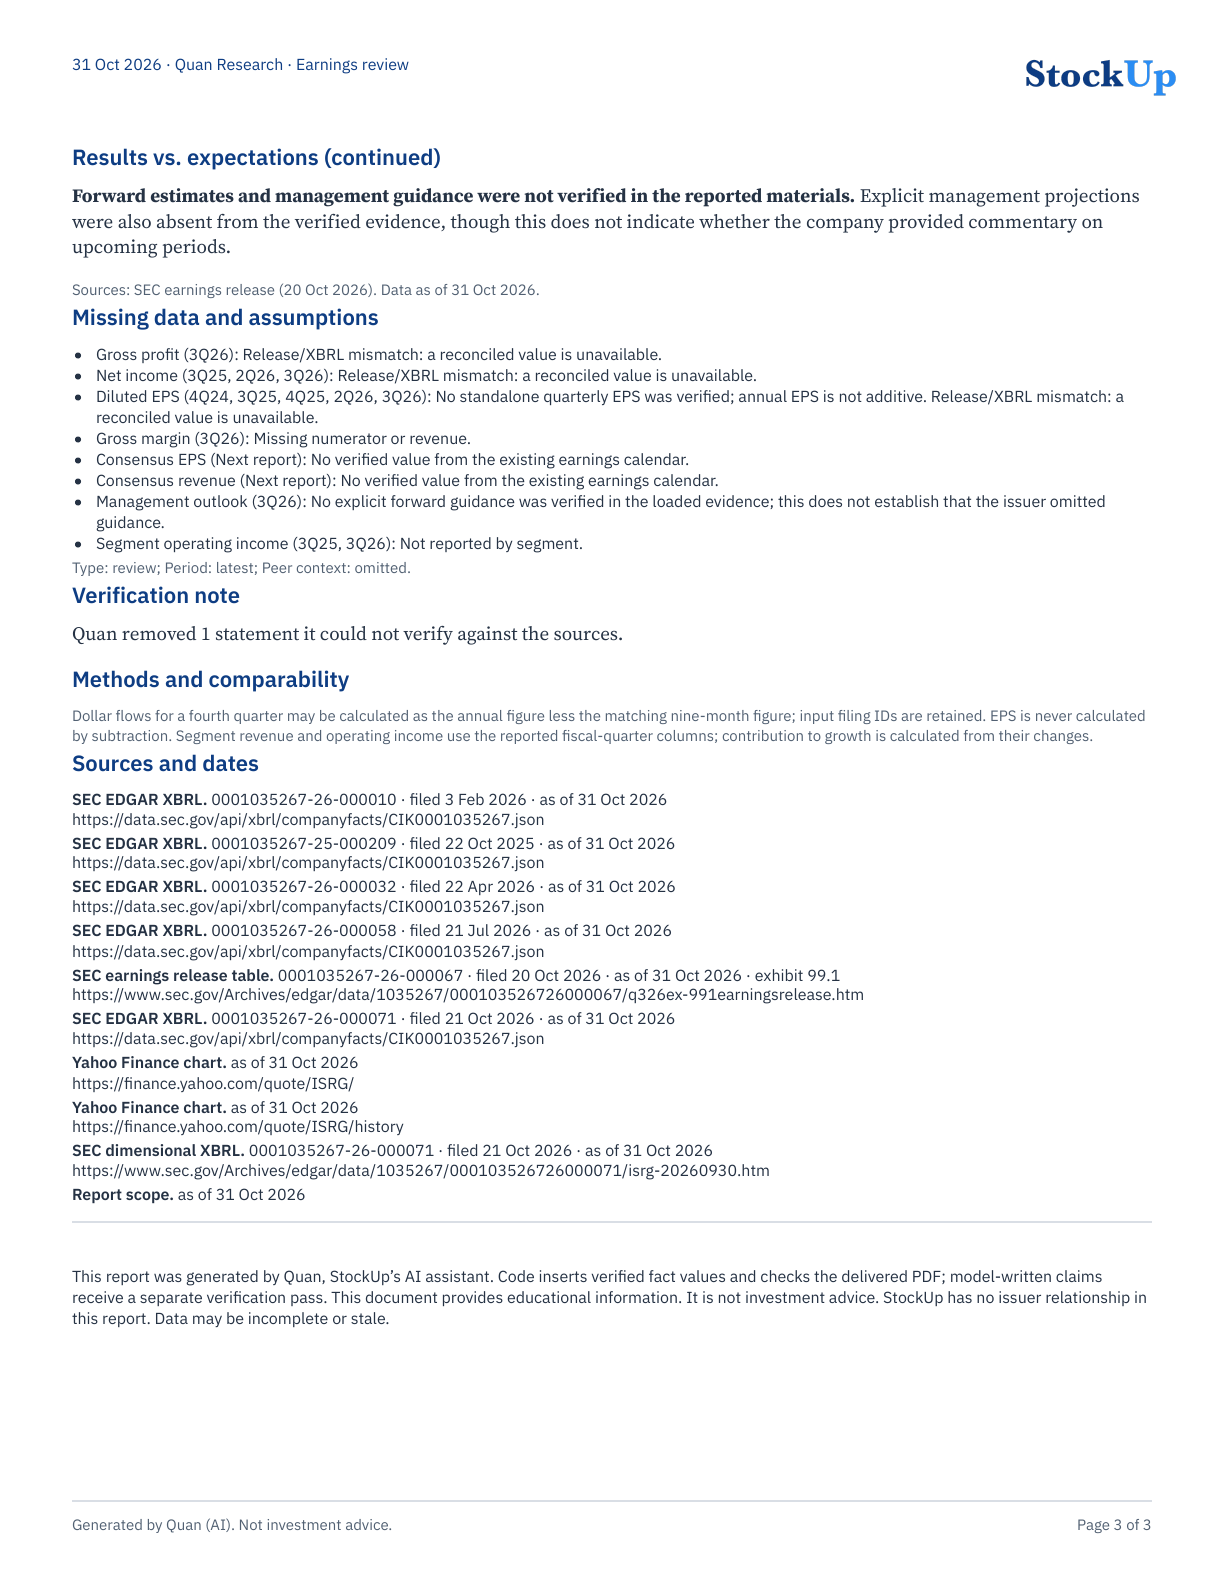
The Intuitive Surgical earnings review flags a different kind of gap. Where the earnings release and the XBRL data disagreed on net income and diluted EPS, it marked the figure unavailable rather than picking one. Each report also notes that one statement was removed because it could not be verified against the sources.
Browse both in the report gallery or read the Quan 3.5 overview. Developers can call the same model as quan-3.5 at POST https://stockup.cc/v1/query for $5.50 per million input tokens and $28.00 per million output tokens; the Quan 3.5 developer guide has the details.
What AI can and can't do with SEC filings
AI saves the most time on extraction: finding the right table, lining up periods, working out changes and keeping a list of sources. It still needs a careful reader.
- It can make mistakes. A model can misread a table, pick the wrong period or confuse a nine-month figure with a quarter. Verify the figures you'll use.
- Sources can disagree. An earnings release and the XBRL data can differ. A good analysis says so instead of choosing quietly.
- It only knows what was disclosed. If a company doesn't report a figure, such as profit by segment, no AI can find it in the filing.
- It isn't advice. Reading a filing tells you what happened, not what to do about it.
AI-generated analysis; not investment advice. Quan can make mistakes. Check any figure you plan to rely on against the original filing, and make your own decisions.
Frequently asked questions
Can AI read a 10-Q accurately?
AI can find figures and explanations in a 10-Q quickly, and it is more reliable when it works from the filing data itself. It can still misread tables or periods, so check any figure you plan to rely on against the filing.
What is the difference between a 10-Q and a 10-K?
A 10-Q covers one of the first three fiscal quarters and its financial statements are reviewed, not audited. A 10-K covers the full fiscal year, includes audited financial statements, and has the complete business description and risk factors.
Why is there no 10-Q for the fourth quarter?
The fourth quarter is covered by the annual 10-K. Fourth-quarter dollar amounts are often worked out as the full year minus the first nine months, but EPS can't be calculated that way because share counts change during the year.
Where does the earnings release fit in?
Most companies furnish their earnings release on Form 8-K under Item 2.02, with the release attached as Exhibit 99.1. It often comes before the 10-Q, which then gives the full statements and notes.
How does Quan 3.5 get SEC filing data?
For analytical questions about a single company, Quan 3.5 reads the most recently reported period from the company's SEC filings before it answers. Its reports list each source with an accession number, filing date and as-of date.
Can I try Quan 3.5 for free?
Yes. A free Starter account includes 3 Quan 3.5 answers a month, and verifying your email adds 150 credits, enough for one 2 to 4 page report.
Can developers use Quan 3.5 to analyze filings?
Yes. Quan 3.5 is on the StockUp API as quan-3.5, at $5.50 per million input tokens and $28.00 per million output tokens, with a prepaid balance. The developer guide covers requests, streaming and billing headers.