An AI earnings report summary pulls the reported numbers out of a company's quarterly release and filings, compares them with the same quarter a year earlier, and explains what changed. A useful one covers revenue, margins, EPS, guidance and segment mix, cites where each number came from, and says plainly what it could not verify.
You can do this yourself in about fifteen minutes with the checklist below. Or you can ask an AI assistant such as Quan 3.5 to draft it, then use the same checklist to check its work.
What goes into an earnings report
Earnings season produces three things for each company, usually within a few weeks of each other. They overlap, but they are not the same.
- The earnings release. A press release with the headline numbers, summary tables and often an outlook. U.S. companies usually furnish it to the SEC on Form 8-K, attached as Exhibit 99.1.
- The earnings call. Management walks through the quarter and takes analyst questions. Changes in guidance, and the questions analysts keep coming back to, are the parts worth your time.
- The 10-Q. The formal quarterly filing, with full financial statements, notes and management's discussion and analysis (MD&A). It can arrive the same day as the release or weeks later. Our guide to AI 10-Q analysis covers it in detail.
The release comes first. The 10-Q is where you confirm the numbers and find the explanations the release left out.
How to summarize an earnings report, step by step
This is the order to read a quarter in by hand. A good AI summary follows the same logic, so you can also use it as a checklist for any summary you're given.
- Fix the period and the comparison. Note the fiscal quarter, the date it ended, and what it is being compared with. Year over year (the same quarter last year) avoids seasonal swings. Many companies don't use a calendar fiscal year, so "Q3" can cover different months for different companies.
- Start with revenue, then find what drove it. Write down total revenue and its percentage change. Then look at segments or product lines. A company growing 8% overall can have one segment growing twice as fast and another shrinking.
- Check margins, not just profit. Gross margin and operating margin show whether growth is profitable. Describe margin changes in percentage points: a margin moving from 30.3% to 19.4% fell 10.9 points, not 10.9%.
- Read EPS twice: GAAP and adjusted. Diluted GAAP EPS follows accounting rules. Adjusted (non-GAAP) EPS leaves out items management treats as unusual. A company that reports a non-GAAP figure has to reconcile it to the closest GAAP measure, so find that table and see what was removed.
- Separate one-time items. Impairments, restructuring charges, legal settlements, investment gains and tax changes can swing net income without saying much about the underlying business. List them, then look at operating results without them.
- Compare against guidance and expectations. Did management raise, hold or cut its outlook? Consensus estimates are analysts' forecasts, not results, so keep them in their own column and never mix them with reported figures.
- Write down what is missing. If a figure is not reported, not comparable with last year, or disagrees between two sources, say so. A summary that lists its gaps is easier to trust than one that quietly fills them.
A worked example from a real Quan report
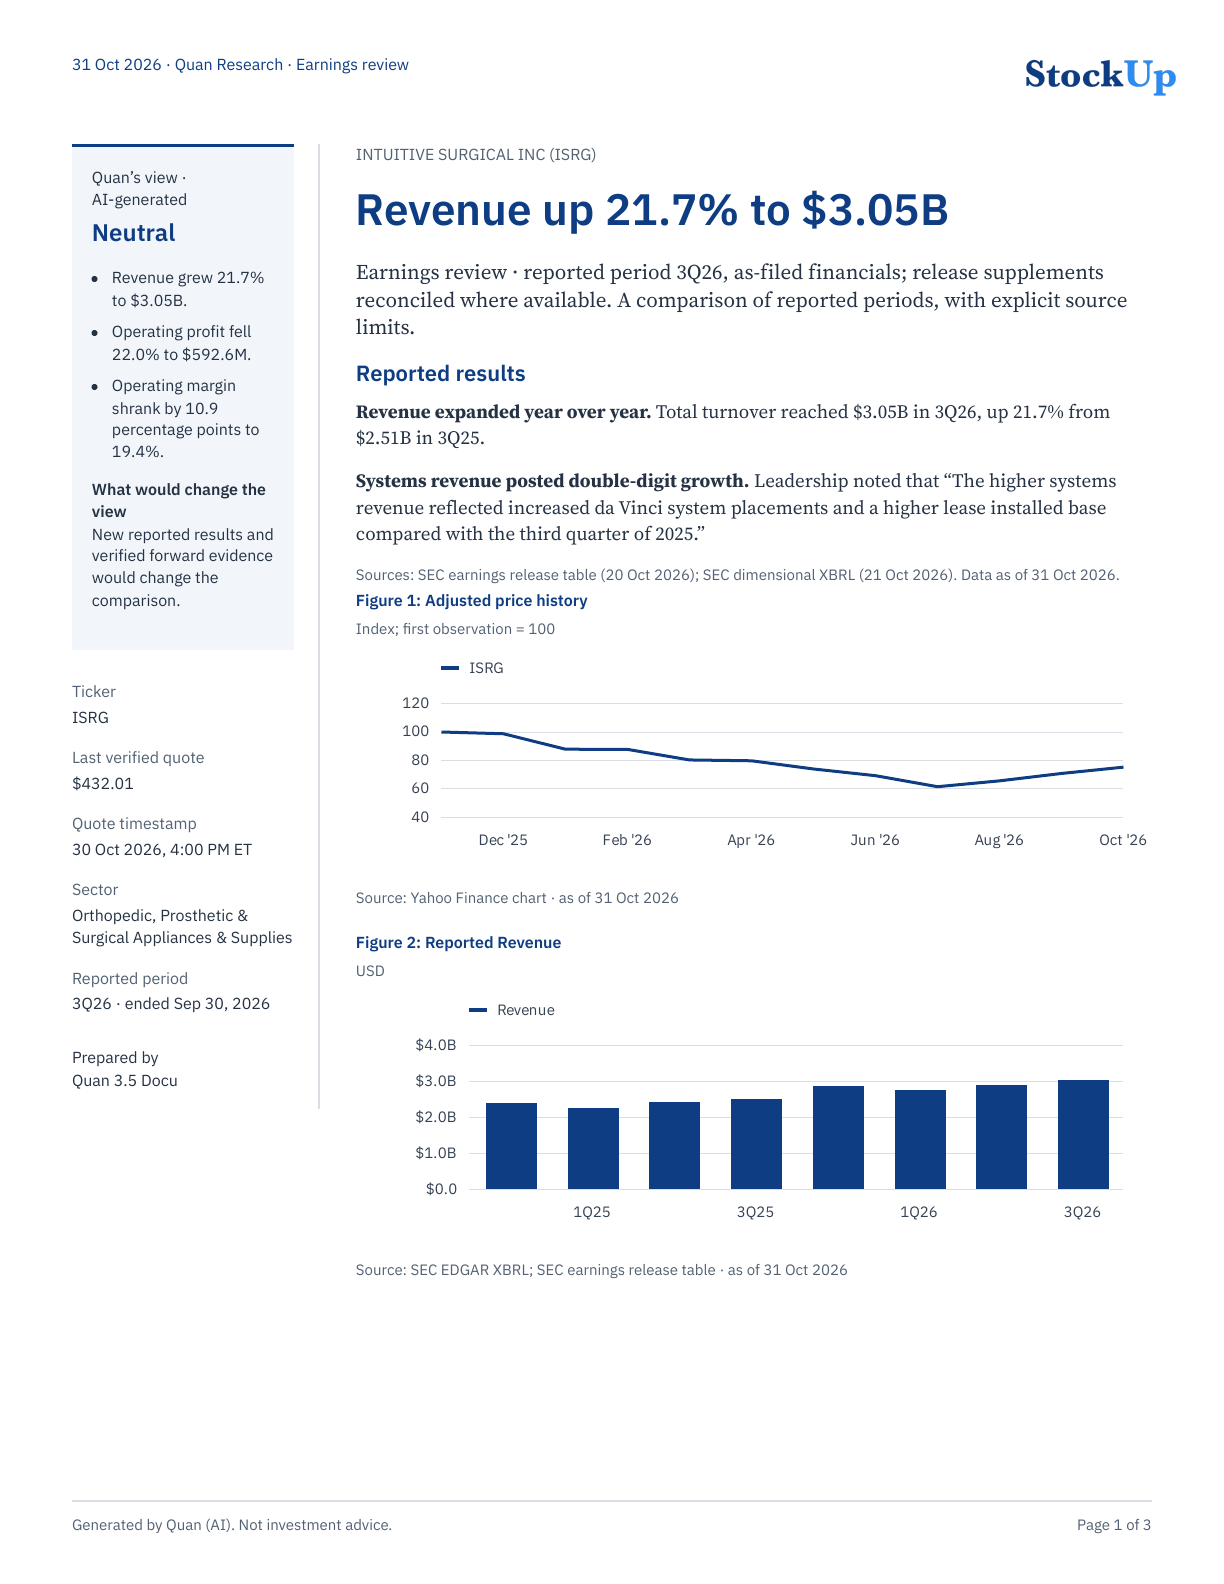
Here is how those steps play out in a sample earnings review Quan 3.5 wrote on October 31, 2026, covering Intuitive Surgical's third quarter of 2026 (the quarter ended September 30, 2026).
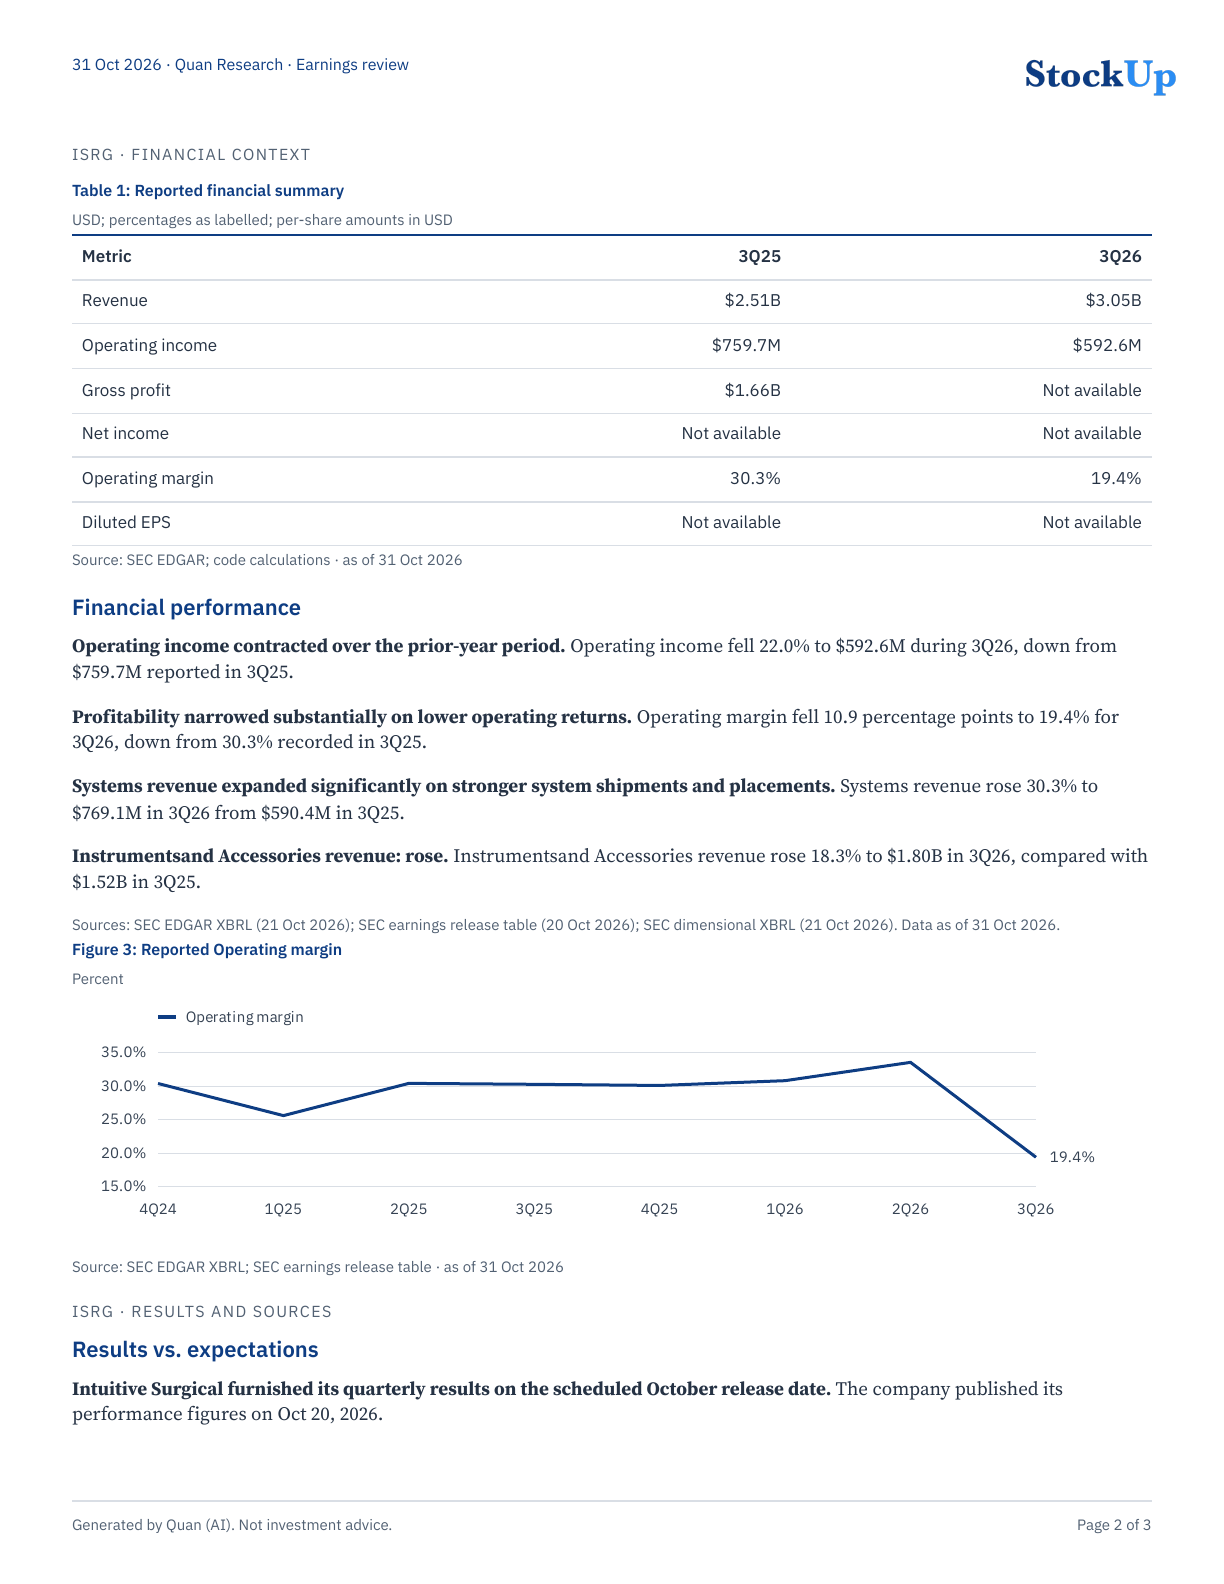
Revenue rose 21.7% to $3.05 billion, from $2.51 billion a year earlier. Systems revenue grew 30.3% to $769.1 million, and instruments and accessories revenue grew 18.3% to $1.80 billion.
The margin step changes the picture. Operating income fell 22.0% to $592.6 million, and operating margin dropped 10.9 percentage points, from 30.3% to 19.4%. Revenue up by about a fifth while operating profit falls by about a fifth is exactly the kind of split a one-line headline misses.
The report does not make up a reason for the drop. Its missing-data section says net income and diluted EPS could not be reconciled between the earnings release and the XBRL data, and that no explicit forward guidance was found in the evidence it loaded. It adds that this does not show the company gave no guidance. That is your cue to open the 10-Q and read MD&A.
How Quan 3.5 writes an earnings summary
When you ask Quan 3.5 an analytical question about a single company, it reads the most recently reported period from the company's SEC filings before it answers. The latest results come in as evidence, rather than from whatever the model remembers.
You can also ask for a written report: a 2 to 4 page PDF with a summary view, a table of reported figures, charts and a list of sources. In the two sample reports:
- Fact values are inserted by code, and the sentences the model writes get a separate verification pass.
- Every source is listed with its SEC accession number, filing date and an "as of" date.
- A "Missing data and assumptions" section names each figure that could not be verified, and why.
- A verification note says how many statements were removed because they could not be checked against the sources. Each sample report removed one.
- Consensus estimates, where shown, are labelled as external estimates rather than reported results.
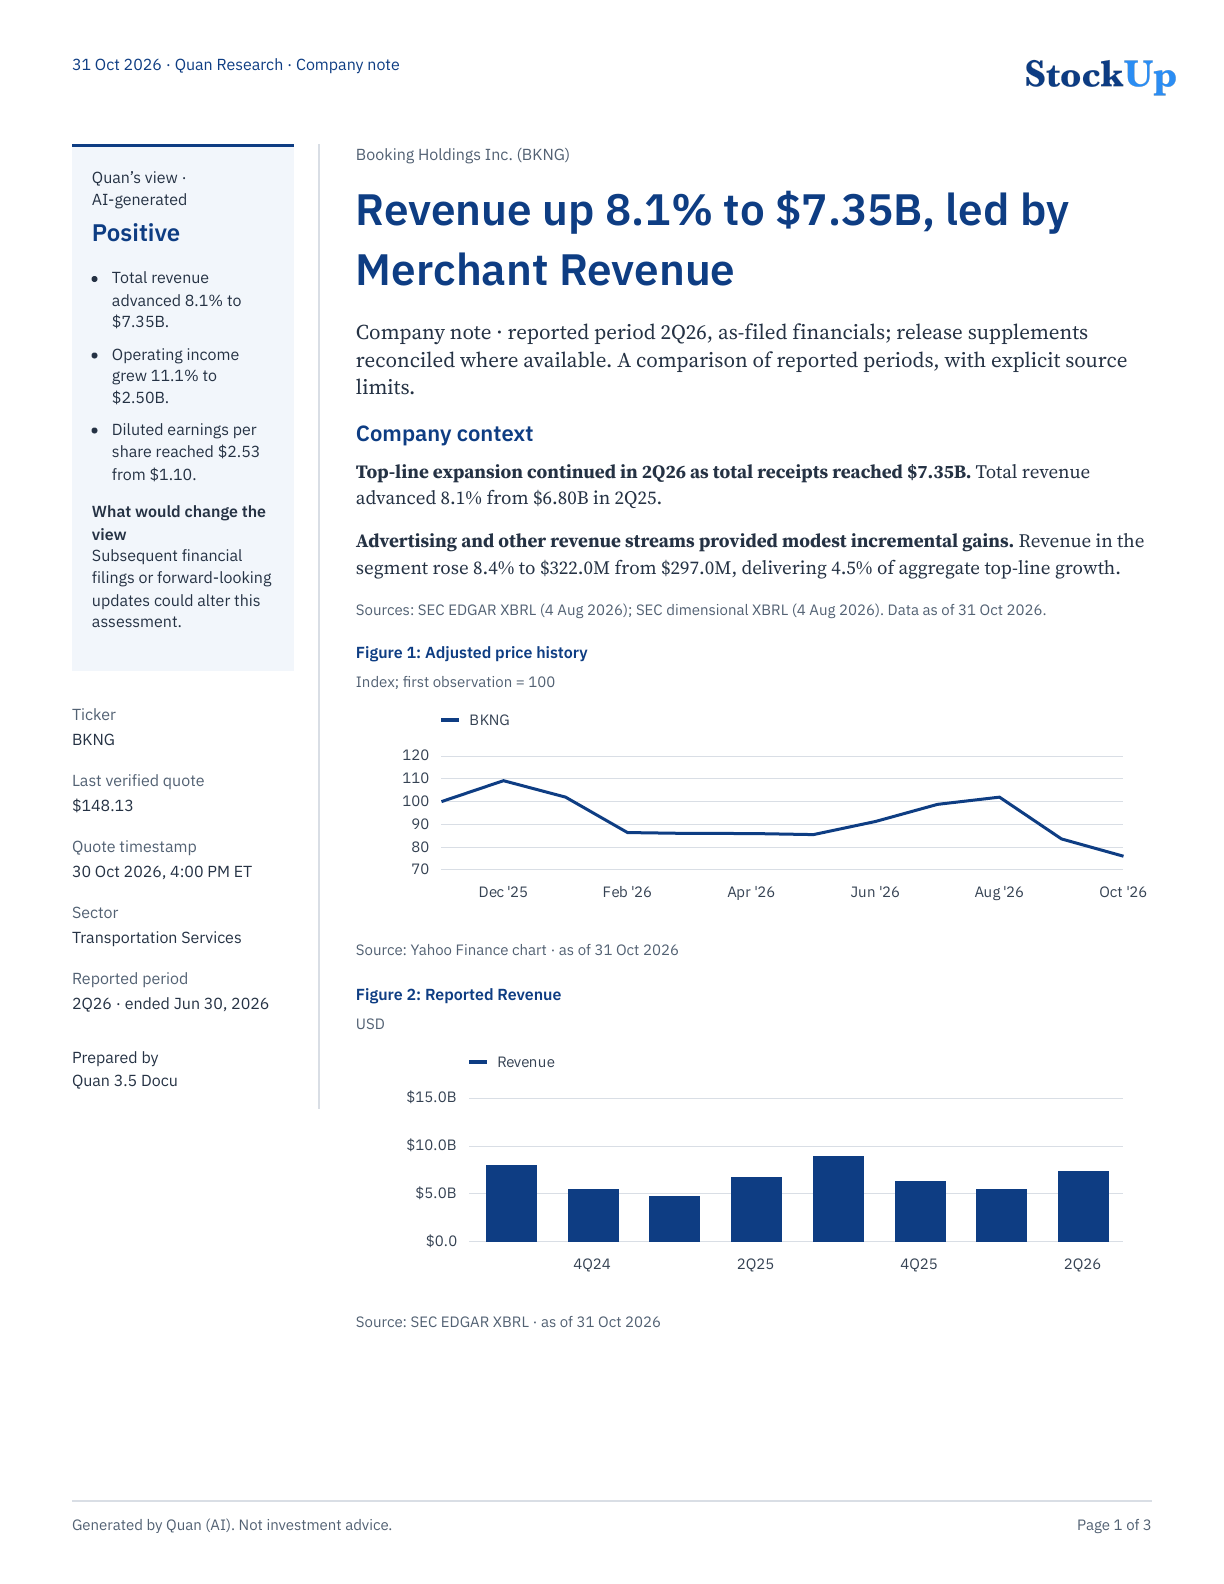
The Booking Holdings company note for 2Q26 shows the same habits. Total revenue rose 8.1% to $7.35 billion, merchant revenue rose 15.0% to $5.13 billion, and diluted EPS went from $1.10 to $2.53. Net income available to common shareholders rose 117.9%, and the report says no explanation for that change was found in the loaded release instead of guessing at one.
Both reports are in the sample report gallery. For more on the model itself, see the Quan 3.5 overview.
Try it on a company you follow. A free Starter account includes 3 Quan 3.5 answers a month and, after you verify your email, enough credits for one report.
Try Quan 3.5 freeUsing AI for earnings call analysis
Calls add context the tables can't: why a margin moved and what management expects next. These questions work whether you're listening yourself or preparing with an AI assistant:
- "What did management say drove the change in operating margin?"
- "Did guidance change from last quarter, and in which direction?"
- "Which segment grew fastest, and how much of total growth did it account for?"
- "Which one-time items affected GAAP results this quarter?"
- "What did analysts ask about more than once?"
If you use an AI tool for this, ask it to quote the release or transcript directly, then check the quote. A paraphrase can easily sound more confident than what was actually said.
What AI can and can't do with earnings reports
AI is good at the slow parts: pulling figures out of tables, working out growth rates and margin changes, and keeping periods straight. It is less reliable at judgment, and it can be wrong about facts.
- It can make mistakes. Models can misread a table, mix up periods or state a figure with more confidence than it deserves. Verify anything you plan to act on.
- Data can be incomplete or stale. Quan's reports say so on their last page and list specific gaps in their missing-data section. Read that section first.
- Sources can disagree. A release and the structured XBRL data filed with the 10-Q don't always match, as the Intuitive Surgical example shows. A careful summary flags the mismatch instead of picking a number.
- It can't tell you what to do. A summary describes what happened. It is not a recommendation to buy or sell.
AI-generated analysis; not investment advice. Quan can make mistakes. Check any figure you plan to rely on against the original filing, and make your own decisions.
Frequently asked questions
Can AI summarize an earnings report accurately?
AI can pull figures and calculate changes quickly, and it is more reliable when it works from the filings themselves rather than from memory. It can still make mistakes, so check the key numbers against the earnings release or 10-Q before you rely on them.
What should an earnings report summary include?
The period and what it is compared with, revenue and what drove it, gross and operating margin, GAAP and adjusted EPS, one-time items, guidance, and a list of anything that could not be verified.
What is the difference between GAAP and adjusted EPS?
GAAP EPS follows standard accounting rules. Adjusted EPS leaves out items management treats as unusual, such as restructuring costs. Companies that report a non-GAAP figure must reconcile it to the closest GAAP measure, so compare the two and read what was excluded.
Is Quan 3.5 free to use for earnings summaries?
A free Starter account includes 3 Quan 3.5 answers a month. After you verify your email you also get 150 welcome credits, which covers one 2 to 4 page report. Plus ($12 a month) and Pro ($20 a month) include more.
How much does a Quan report cost after the free one?
A 2 to 4 page report costs 150 credits, which is $1.50. Quan shows the cost before it starts writing, and if a report fails the credits go back to your balance.
Where does Quan get the numbers?
For analytical questions about a single company, Quan 3.5 reads the most recently reported period from the company's SEC filings. Its reports list each source with a filing ID and date, and name any figures they could not verify.
Is an AI earnings summary investment advice?
No. It is AI-generated analysis for research and education. Use it to understand a quarter faster, check the figures that matter to you, and make your own decisions.